Delivery, live from GitHub
One leader. A line of agents. A team's worth of shipping.
2,993 pull requests merged since April, across 22 repos. Counts only, no code.
Most of these were written by AI agents I direct. Every one runs automated checks, and the risky ones wait for me.

1
Casey White
One leader, directing AI agents
Agents on the line
A conventional team merging the same work in the same 29 weeks
69–86people
52 developers, in 7 squads
Plus 17 to 34 people around them
Product owner and manager 5–9
UX and UI design 3–5
QA and testing 5–10
DevOps and platform 1–3
Scrum master 3–7
2,993
pull requests merged
96%
merged of those opened
29
weeks of work
170
active days
85
merged in a typical active week
The line
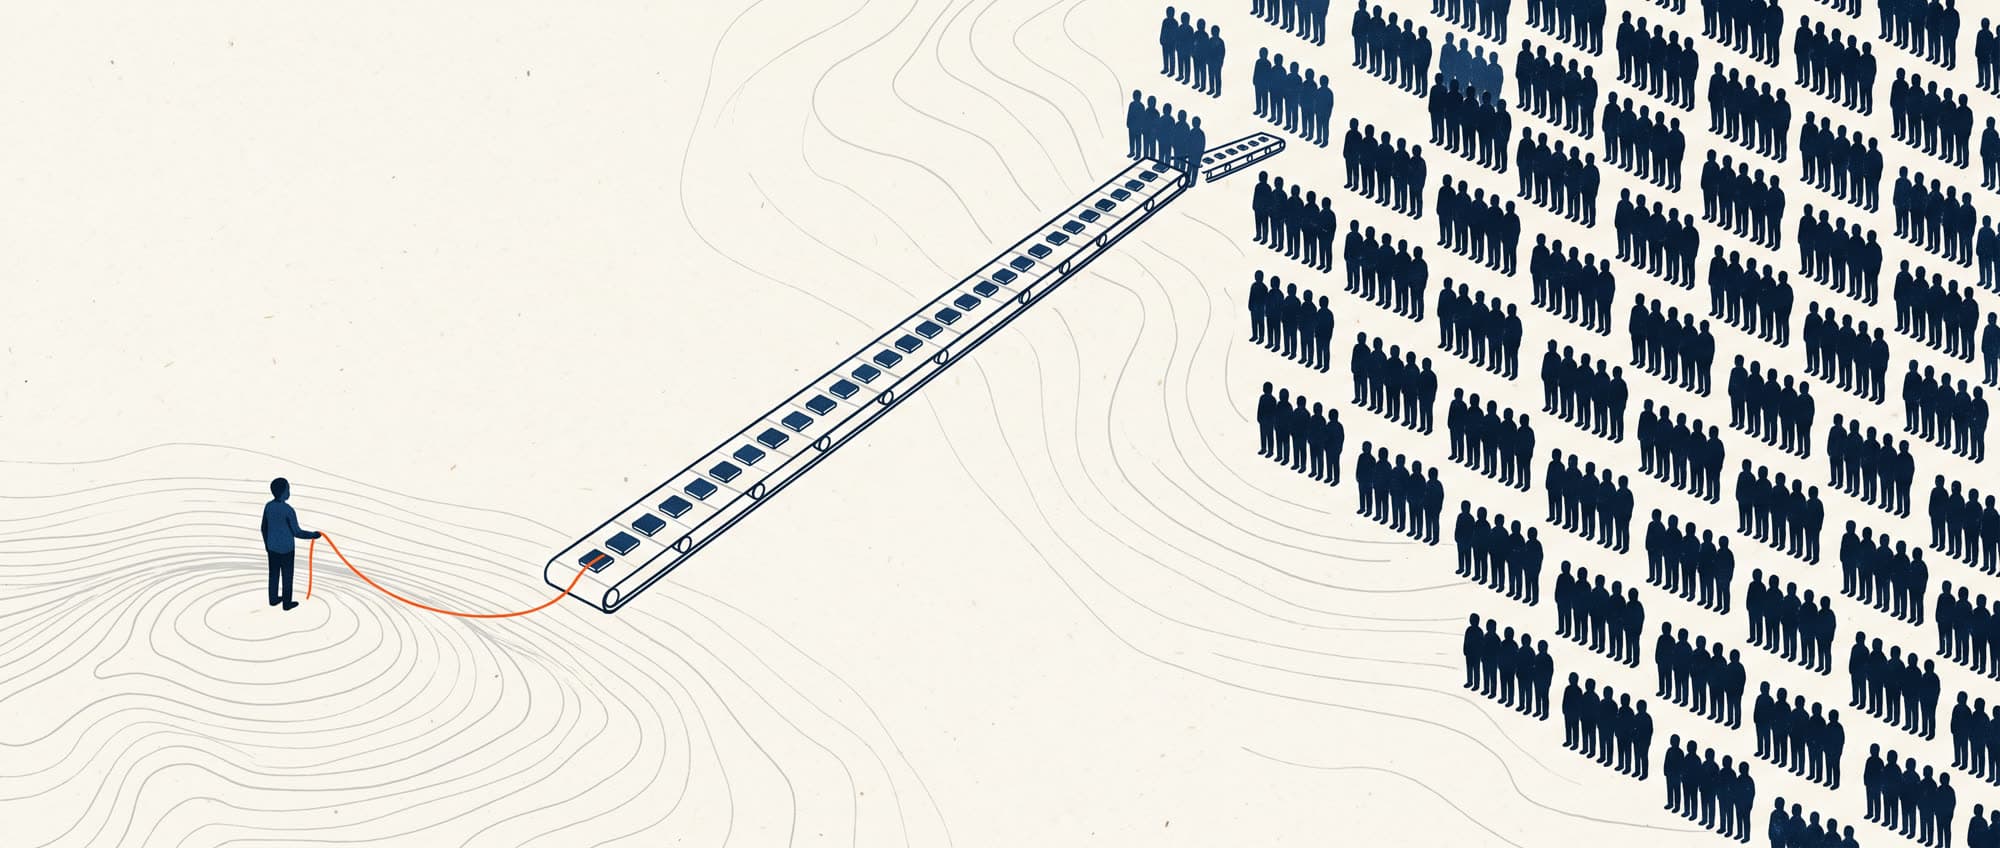
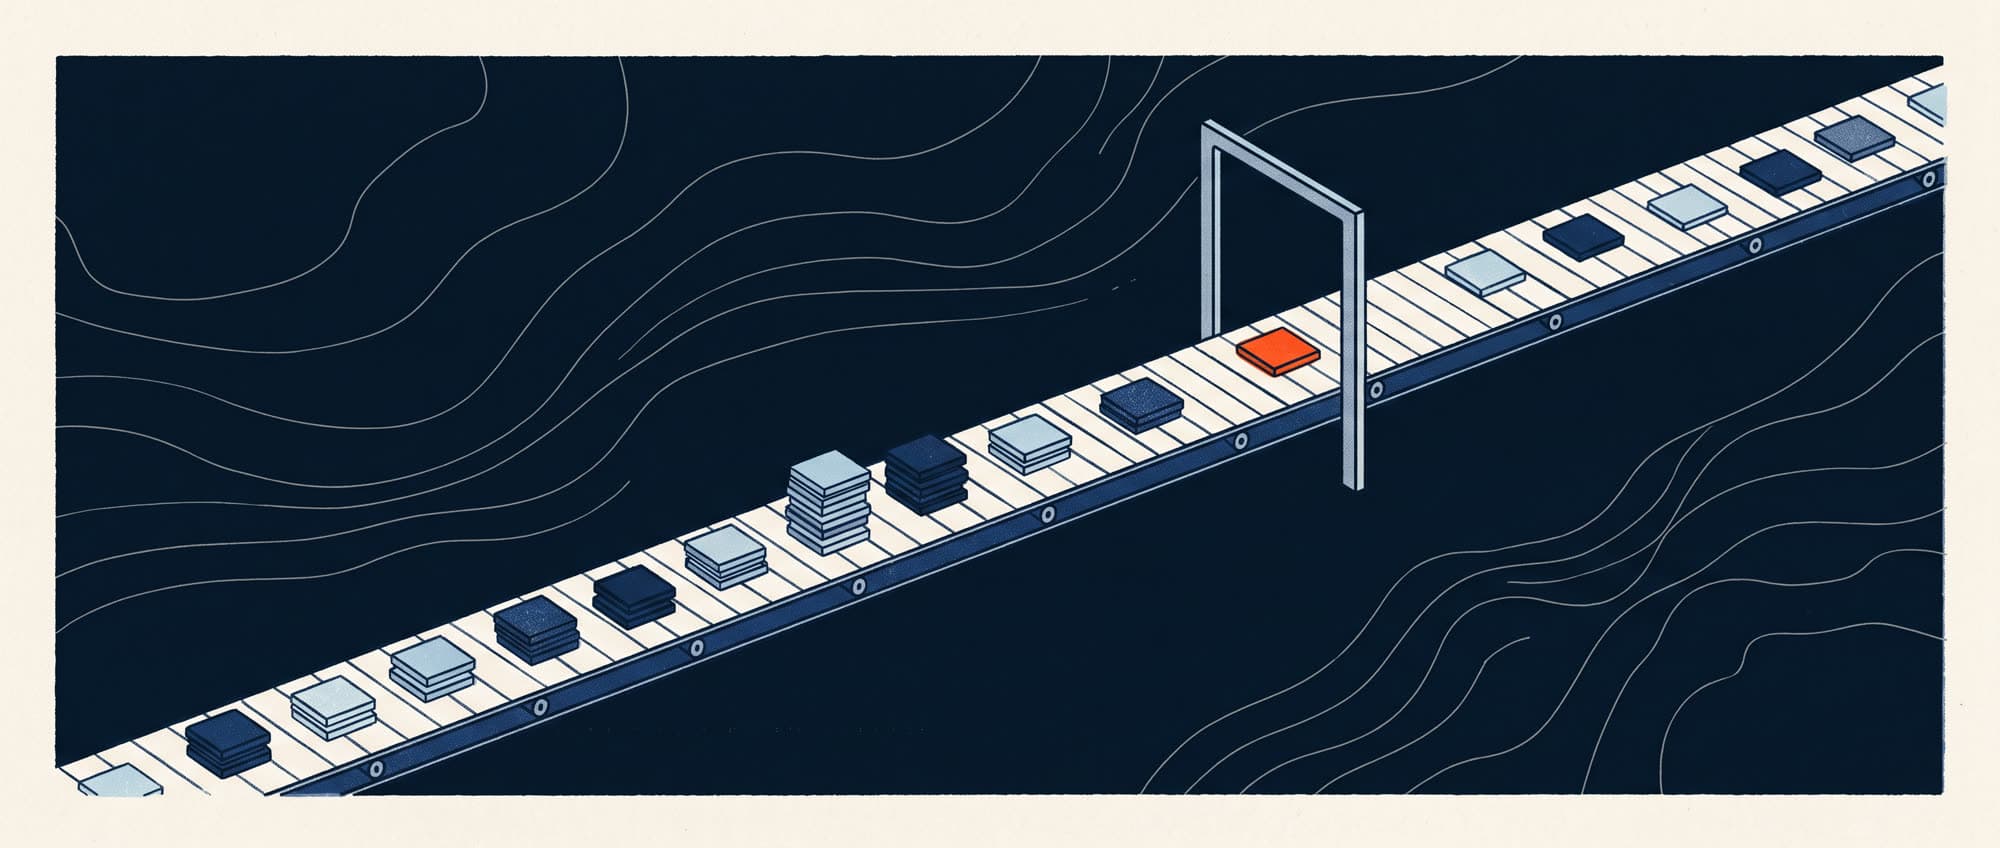
Every tile is one pull request merged since April, in the order it landed. Shade shows size. The belt keeps one speed, so busy days pile up and quiet weeks run bare.
How the work is governed
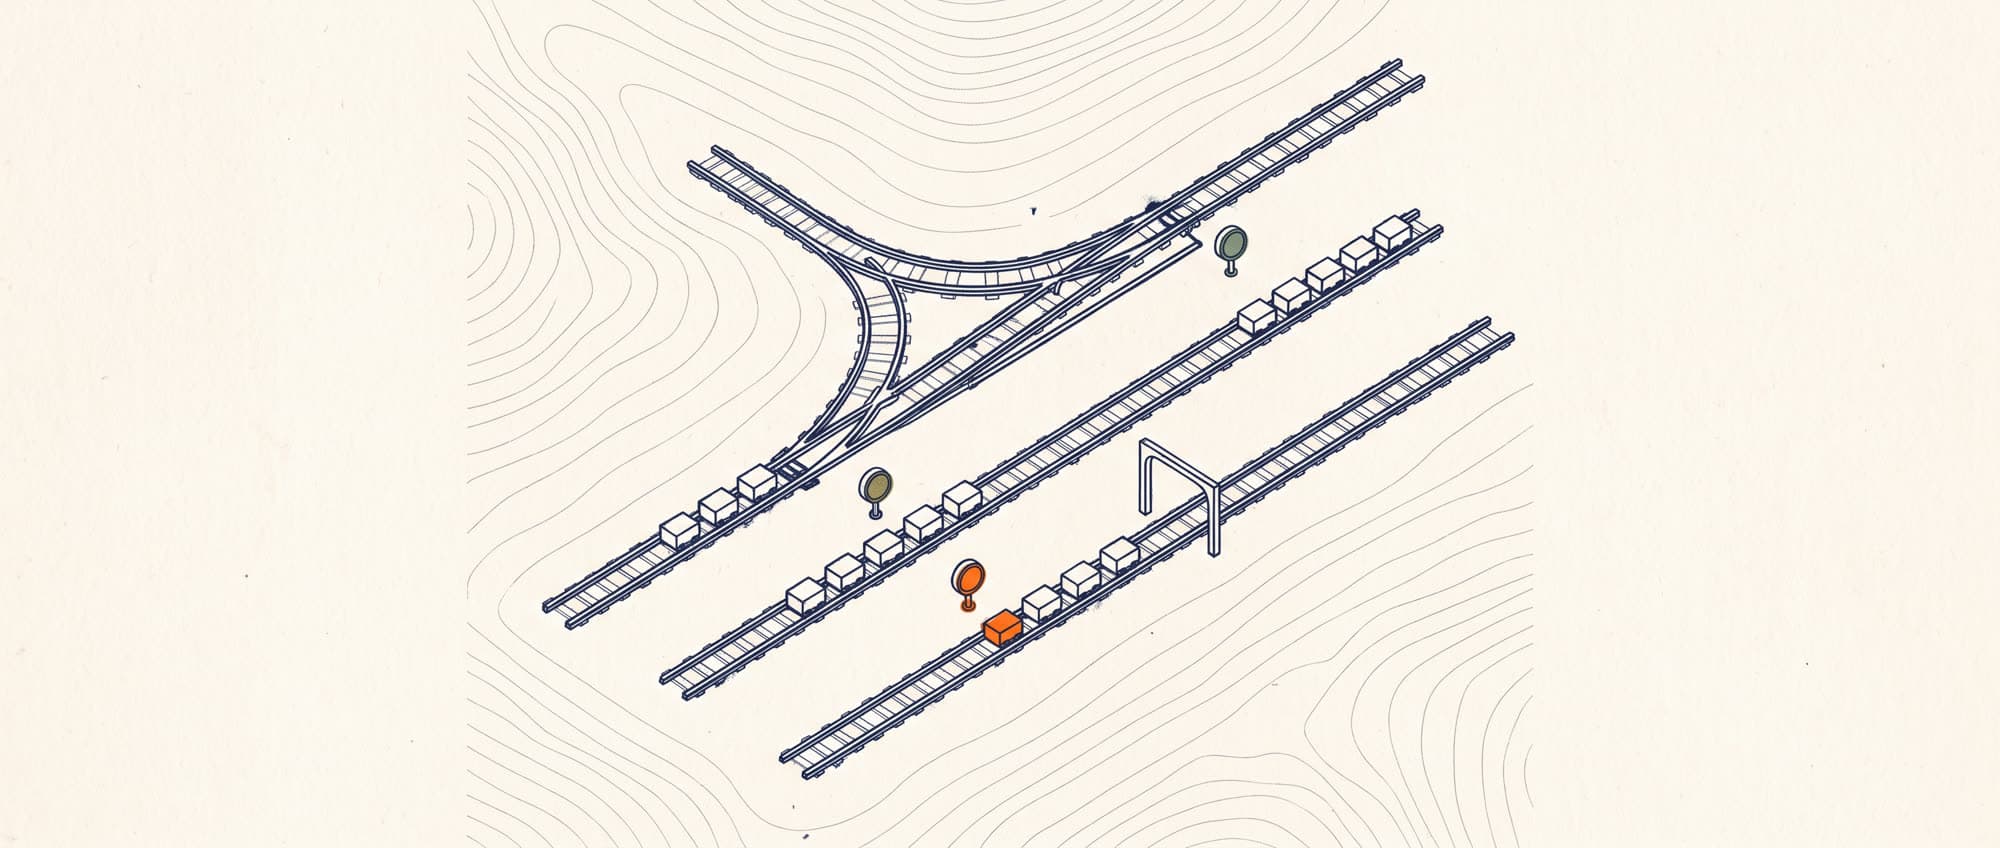
Volume means nothing without control. This is the same change control I ran at scale, pointed at agents.
16,004
automated CI runs, in 17 repos
6
checks on a typical merged pull request
2,451
test files, 290 of them end to end
127
red-tier changes that waited for my approval
Every change gets a risk tier. Green merges on its own. Amber gets QA first. Red waits for me.
154 merges went through with a failing check. Most were problems with GitHub's runners and our hooks, not failing tests. 4 changes were reverted.
Call the gate
You 0 · The gate 0
Pick a change, or write your own, and call the risk before the gate does. The gate is Jev, a decision model, ruling live through the Vercel AI Gateway.
Pick a change
Merges on its own
QA looks first
Waits for Casey
The build sheet
What the work was. Each pull request is sorted by what it touched and how big it was. Major builds change more than 700 lines.
- Screens and UX973
540 features · 298 major builds
- Native mobile459
212 features · 103 major builds
- Data and backend312
160 features · 107 major builds
- Specs, plans and docs243
56 features · 73 major builds
- Website, SEO and analytics193
89 features · 60 major builds
- Payments and subscriptions136
74 features · 43 major builds
- Builds, CI and deploys136
12 features · 12 major builds
- Notifications and messaging134
83 features · 48 major builds
- AI and agents134
60 features · 30 major builds
- Sign-in, accounts and security132
63 features · 33 major builds
- Tests and monitoring61
7 features · 14 major builds
- Media and video52
30 features · 14 major builds
2,993 of 2,993 sorted by a model from their titles; the rest by keyword rules.
The organisation I didn't hire
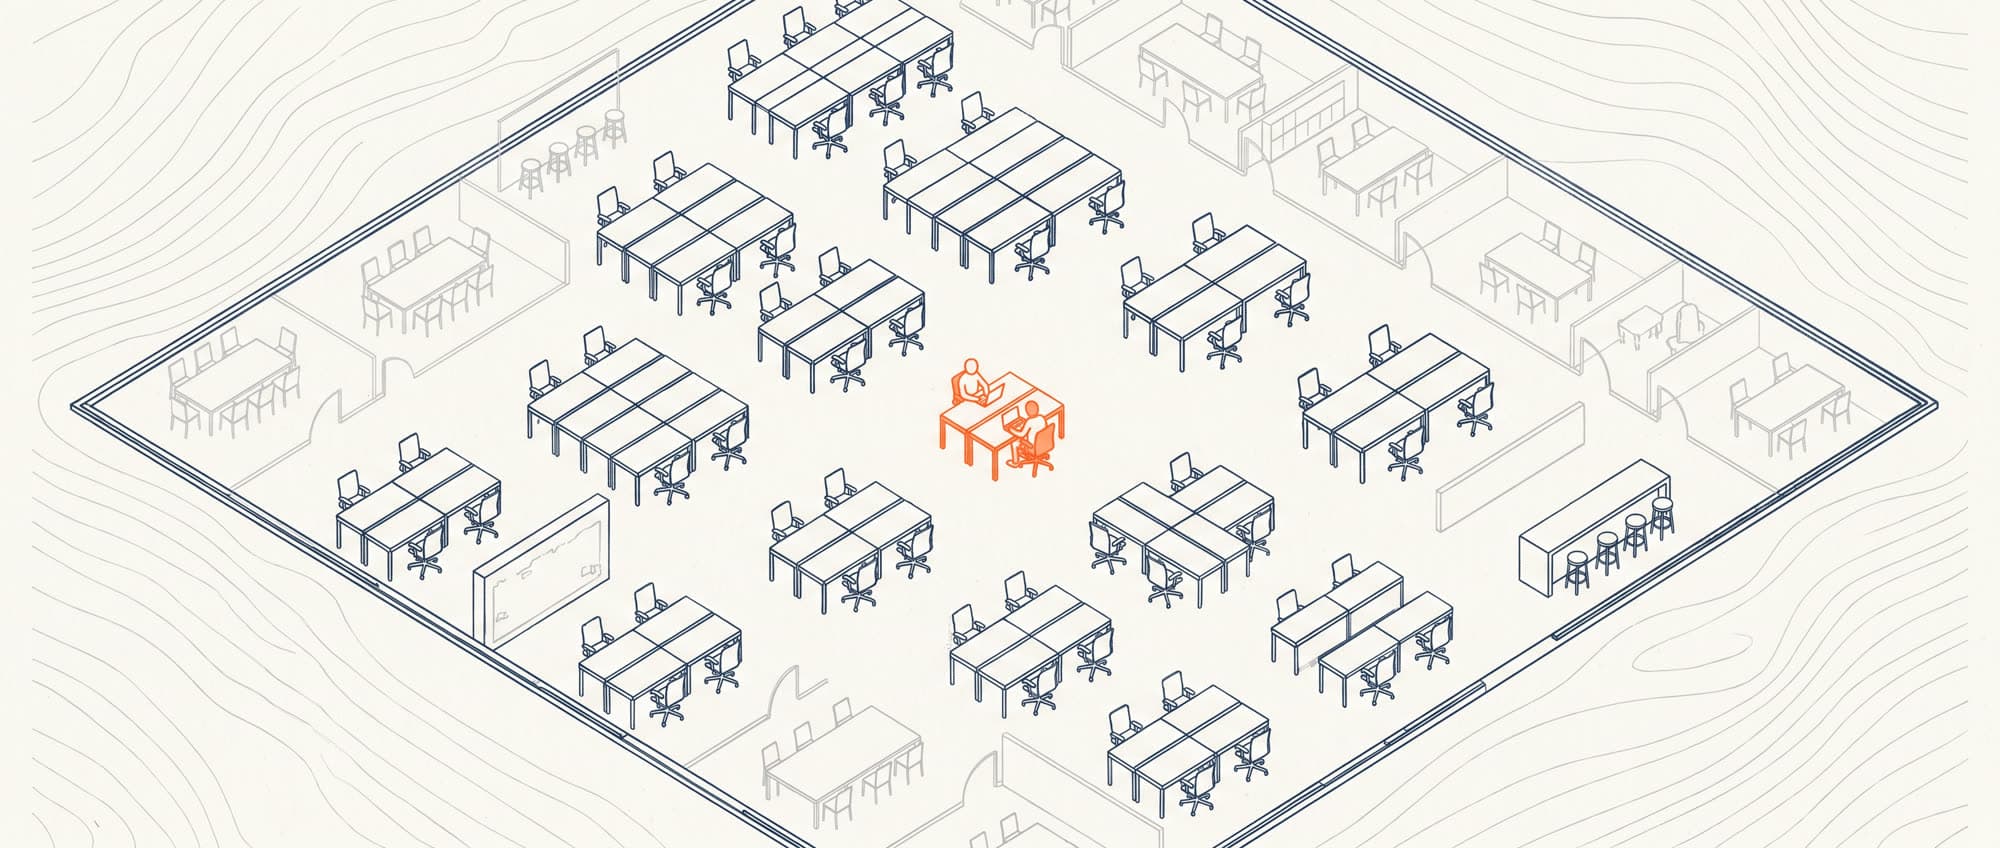
This is product delivery, not just code. Around 52 developers, a conventional company puts these people. Here, every seat is the same person directing agents.
Casey, with agents
Product, design, QA, platform and scrum roles alone: 17 to 34 people at published ratios.
Product owner and manager
243pull requests touching this role
a conventional team has 5 to 9 here
UX and UI design
973pull requests touching this role
a conventional team has 3 to 5 here
QA and testing
67pull requests touching this role
a conventional team has 5 to 10 here
DevOps and platform
164pull requests touching this role
a conventional team has 1 to 3 here
Scrum master
the pipeline runs the cadence
a conventional team has 3 to 7 here
Mobile engineering
459pull requests touching this role
inside the 52 developers
Backend and data
446pull requests touching this role
inside the 52 developers
AI engineering
134pull requests touching this role
inside the 52 developers
Security and identity
132pull requests touching this role
inside the 52 developers
Marketing and growth
245pull requests touching this role
Revenue and pricing
136pull requests touching this role
Technical writing
409pull requests touching this role
Founder seats, no headcount benchmark: sales, marketing, pricing, client discovery.
Next seats on the line
- Sales development
- Marketing operations
- Content and social
- SEO and AEO
Now I'm pointing the same system at distribution: outbound and inbound sales, lead generation, social and email marketing, and search and answer-engine visibility with lead magnets.
Pave 2024; Mind the Product · Founders Circle 2026; NN/g 2020 · LambdaTest Future of QA, 2023 · DX developer-productivity headcount, 2026 · Scrum Guide 2020: a team of 10 or fewer
The rhythm
Kept up for months, not one burst. The dips stay in.
Merged pull requests per week
- Merged pull requests per week
- A squad of 7 at a typical pace
- One developer
Busiest week: 316. Median week: 85.
The jump in September is when the automated pipeline went live.
Not small changes
A typical pull request here changes 247 lines across 7 files. A typical one across the industry changes 47.
- Under 100 lines949
- 100 to 7001,201
- 701 to 2,000534
- Over 2,000309
Race the squads
Grey lines are squads of 7, each merging at a published pace. Add squads until they keep up.

Pace
Still behind. Add a squad.
One squad alone would need about 4.1 years.
Depending on the pace: 4 to 15 squads. Output equivalent, not value.
Three models, three jobs
01
Claude, as coding agents
Wrote most of these pull requests, to my specs, through the pipeline.
02
Gemma, on my Mac
Sorted the first 2,993 pull request titles, free and private. Titles never left the machine.
03
Jev, through the Vercel AI Gateway
Rules on the gate above, live, and sorts each day's new pull requests, at a fraction of a cent per thousand calls.
Where things stand
Output is not value. Here is what it has turned into so far.
A field-service app for small trade firms
App Store and Google Play, 8 languages, 160 countries
In buildPilotLiveA consumer subscription app
Google Play; a native iPhone build is in progress
In buildPilotLiveA short animated series from that app's characters
TikTok, YouTube and Instagram
In buildPilotLiveA client portal for consulting engagements
In use with pilot clients
In buildPilotLiveA consultancy website
In buildPilotLiveA casual mobile game
Google Play, no active development
In buildPilotLiveSeveral smaller pilots
In build or paused
In buildPilotLive
First paying customers are the goal for the coming quarter.
Before this
Global digital products across 60+ countries, a team of 34 and a £3.2M budget, at a FTSE 100 industrial group.
The merge gate is the same change control I ran at scale, applied to agents.
How I leadQuestions you'd ask me
+Did you write the code?
Mostly no. AI agents wrote most of it. I set the work, write the specs, review what matters and decide what ships.
+Who reviews it?
Every change runs automated checks and gets a risk tier. Green can merge on its own, amber gets QA, red waits for me.
+What broke?
154 merges went through with a failing check, mostly GitHub runner and hook problems. 4 changes were reverted.
+What's the business result?
Early. First paying customers are the goal for the coming quarter, and the same system now runs sales and marketing work.
+Can you lead people, not just agents?
Yes. Before this I led a team of 34 across 60+ countries. This page shows the other half: I know what I'm delegating, because I can do it.
The numbers, plainly
Everything above, without the motion. Print it for a hiring panel.
| Pull requests merged | 2,993 |
|---|---|
| Opened | 3,134 |
| Commits | 5,003 |
| Repos with merged work (of 33, 30 private) | 22 |
| Weeks, first merge to latest | 29 |
| Active days | 170 |
| Median lines per pull request | 247 |
| Automated CI runs | 16,004 |
| Test files | 2,451 |
| Red-tier changes approved by Casey | 127 |
| Merged with a failing check | 154 |
| Reverted | 4 |
| Pace | Developers | Squads of 7 | Sprints of one squad |
|---|---|---|---|
| Fast, AI-assisted 4/wk | 26 | 4 | 53 |
| Typical 2/wk | 52 | 7 | 107 |
| Slower 1/wk | 105 | 15 | 214 |
| Month | Opened | Merged |
|---|---|---|
| 2026-04 | 37 | 35 |
| 2026-05 | 572 | 553 |
| 2026-06 | 367 | 359 |
| 2026-07 | 263 | 253 |
| 2026-08 | 170 | 165 |
| 2026-09 | 677 | 667 |
| 2026-10 | 983 | 910 |
| 2026-11 | 65 | 51 |
How the work is governed
Every change gets a risk tier. Green merges on its own. Amber gets QA first. Red waits for me. 154 merges went through with a failing check. Most were problems with GitHub's runners and our hooks, not failing tests. 4 changes were reverted.
Global digital products across 60+ countries, a team of 34 and a £3.2M budget, at a FTSE 100 industrial group. The merge gate is the same change control I ran at scale, applied to agents.
Method and sources
- Counts merged pull requests authored under my GitHub account from April 18, 2026 to November 3, 2026. Agents' pull requests merge under the same account.
- Pull requests measure output, not value or quality. No single number captures productivity.
- Equivalents use the same total at every pace; only the benchmark changes. A squad is 7 people, my choice within the Scrum Guide's 10 or fewer.
- Roles touching each pull request come from its title, sorted by a model. Support-role ratios are published benchmarks applied to developers only.
- Repo names, titles and code never leave GitHub. The page reads one file of counts, refreshed daily.
Sources: Graphite research: the median developer merges 2 a week · Faros AI, AI Productivity Paradox, 2025 (high-AI teams merged 98% more) · Scrum Guide 2020: a team of 10 or fewer · Graphite research, median pull request size · Pave 2024; Mind the Product · Founders Circle 2026; NN/g 2020 · LambdaTest Future of QA, 2023 · DX developer-productivity headcount, 2026
Want this pointed at your work?

For clients
Book a callFor hiring panels
Print the summaryFor partners
See the studio